


Accurate Metrics are Essential when Benchmarking
Have you ever considered that the metrics reported by your benchmark tool might be inaccurate?
As with any work based on analysis and measurements, a common mistake is to think you know everything about your software/architecture.
Metrics are hard and evaluating them is a crucial part of a benchmark report. Metrics can be confusing, complicated, unreliable, inaccurate, and even plain wrong (due to bugs).
The simple task of measuring latency can hide one of the biggest pitfalls of the benchmarking industry — We’ll take a look at it in the following sections.
The Known-Unknowns is a term used to express the risks that come from situations that are so unexpected that they would not be considered — I wrote an article on Performance Methodologies that expands on this subject performance-wise.
This article’s objective is to transform Unknown-Unknowns into Known-Unknowns. Therefore, the next subsections include some behaviours you may face during the benchmarking process.
Benchmark Tool Limitation
A common problem is one of benchmarking-benchmark, where the result reported is limited by the benchmark software itself. The load tool is like any software, it can and eventually will be affected by hardware limitations, for instance, autocannon (an HTTP/1.1 benchmarking tool) can saturate the CPU, where the autocannon process reaches 100% affecting the load generated, and consequently the final result.
This is a fairly common issue when benchmarking on a small machine or using a high number of connections. All the benchmark tools have their own limitations, some of them describe their limitations on the main page.
Normally, a good approach is to play with the benchmark options until reaching the application limitation (e.g increasing the connections). Eventually, a constant result, even increasing the benchmark, parameters may tell you where the limitation is:
- In the software (by far the most common)
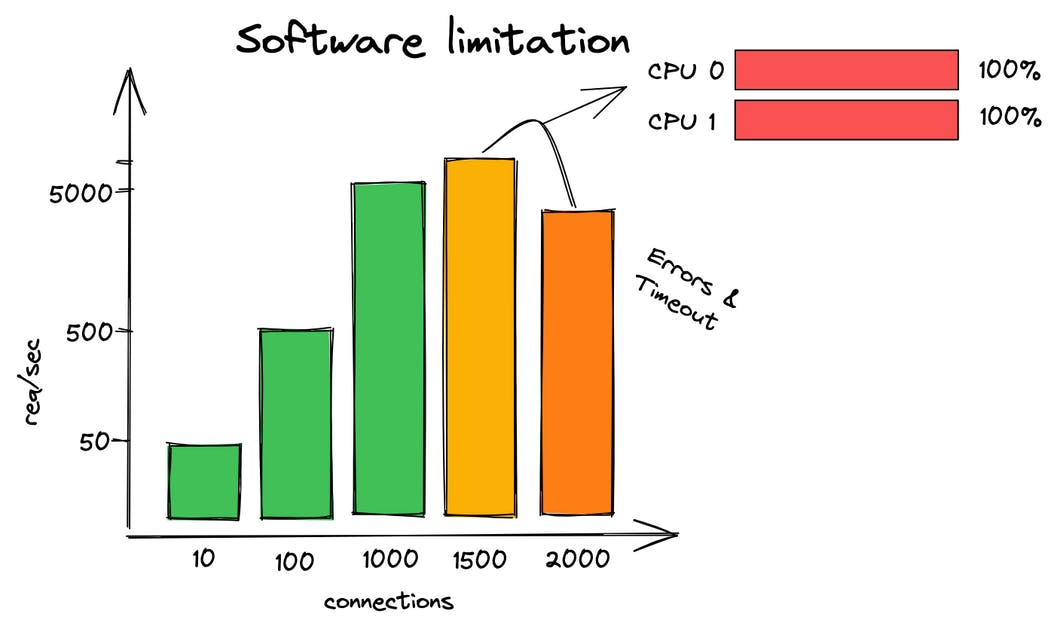
- In the benchmark tool
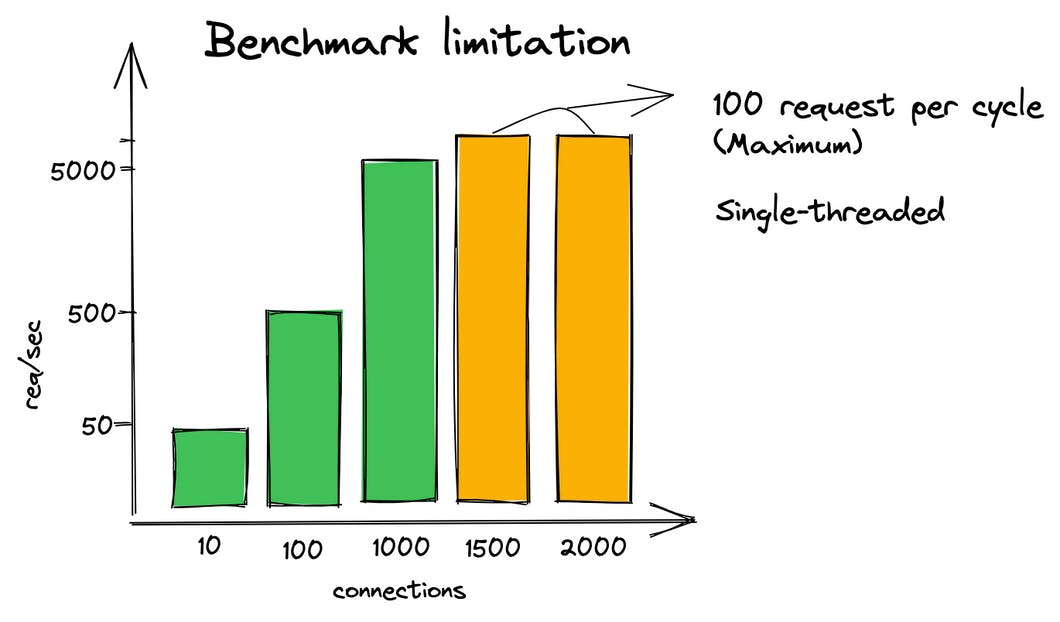
Hence, making sure the benchmarking tool is not limiting the benchmark result is essential.
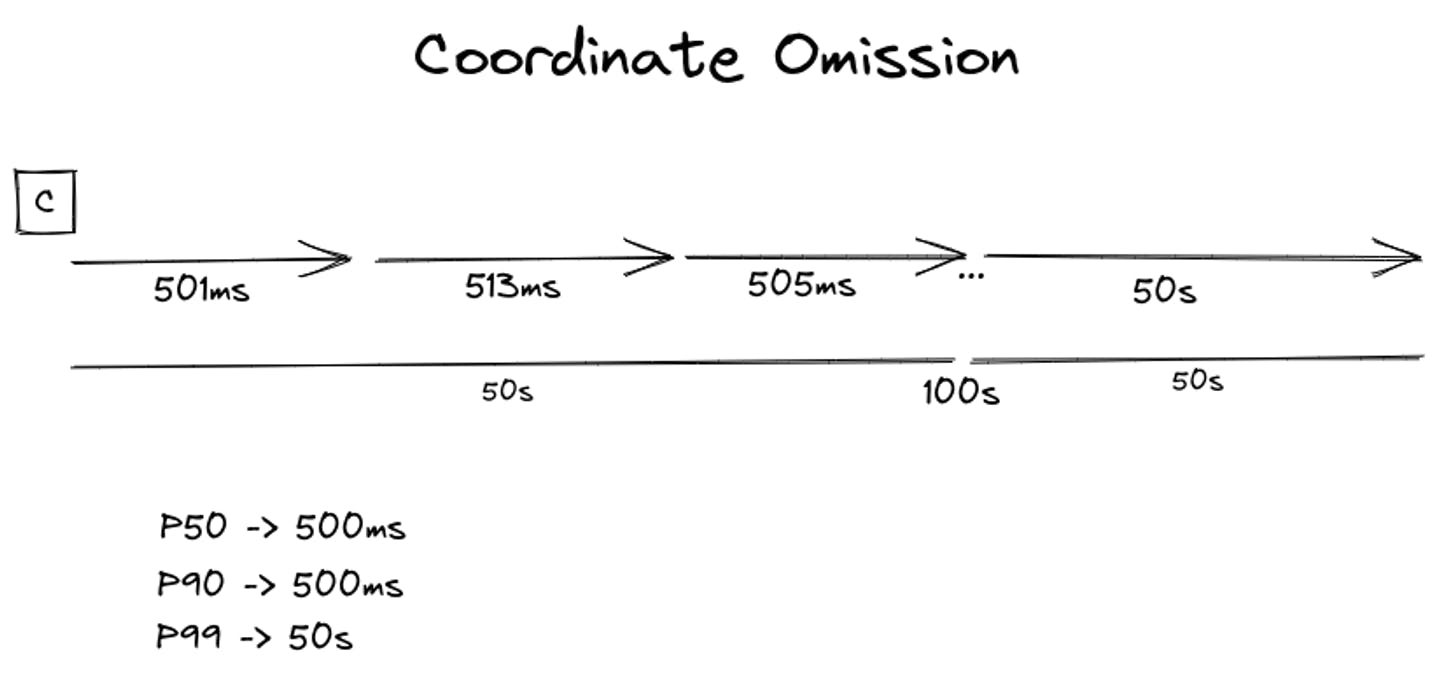
Coordinate Omission
The _coordinated omission is a term coined by Gil Tene to describe the phenomenon when the measuring system inadvertently coordinates with the system being measured in a way that avoids measuring outliers._
This phenomenon is better explained in a practical way, therefore, let’s assume you have a simple HTTP Server with the following constraints:
- 500ms response time to the first 120 requests, which means, 120 requests in 60 seconds.
- 59sec response time to the rest.
- Run the load test tool for 2 minutes.
The tool used for this experiment will be Apache JMeter which is fairly popular among load generators. Therefore, the HTTP Server is similar to the following snippet:
const http = require('http');
let count = 0;
const requestListener = function (req, res) {
  // 60sec
  if (++count > 120) {
    setTimeout(() => {
      res.writeHead(200);
      res.end('Hello, World!');
    }, 59000)
  } else {
    setTimeout(() => {
      res.writeHead(200);
      res.end('Hello, World!');
    }, 500)
  }
}

const server = http.createServer(requestListener);

server.listen(8080);
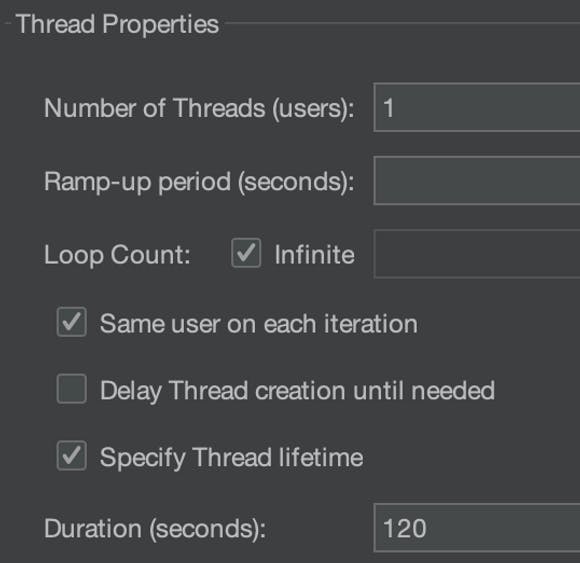
And the Apache JMeter setup is simple, to avoid complexity, just a single thread/user is required and, as previously mentioned, the execution time is 120 seconds (2 minutes).
When evaluating a benchmark result, it is common sense to look at percentiles, such as:
- P50 – 50% of users experience X as the maximum response time.
- P90 – 90% of users experience X as the maximum response time.
- P99 – 99% of users experience X as the maximum response time.
Therefore, before running Apache JMeter, one can expect:
- A P50 of 500ms – 50% of users experience 500ms of delay.
- A P90 of 59s – 90% of users experience 59s of delay.
- A P99 of 59s – 99% of users experience 59s of delay.
However the Apache Jmeter result is quite interesting:
| # Samples | Avg | Med | 90% Line | 95% Line | 99% Line | Min | Max |
| 122 | 1042 | 501 | 502 | 502 | 8000 | 500 | 59002 |
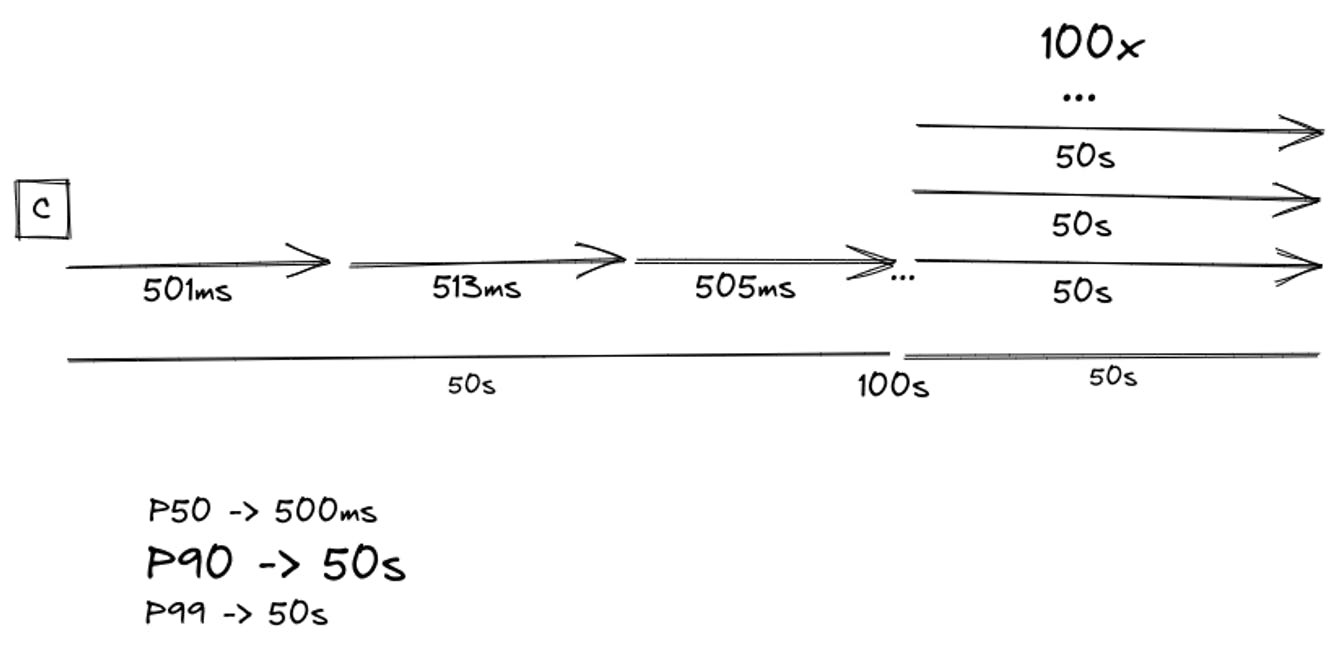
A P90 and P95 of 502ms is definitely not expected. The reason is that Apache JMeter suffers from Coordinate Omission. As demonstrated in the image below, instead of sending a request at a certain rate regardless of the state of the previous request, it waits for the previous request to complete before triggering the next one.
Usually, developers don’t even consider an issue like this in well-established software like Apache JMeter. In addition to showing incorrect information, it always shows your software is performing better than it really is (after all, 50.1% of the users experienced 59 seconds of delay instead of 500ms). Usually, having inaccurate information is worse than having no information.
The solution is to use a benchmark tool that supports the ‘request rate’ option.
wrk is another benchmark tool that doesn’t handle coordinate omission. For this reason, Gil Tene created wrk2 which, besides providing a constant throughput load generation, fixes the coordination omission by including the --rate option (default 1000ms) which stands for total requests per second.
Autocannon is inspired by wrk2, therefore, it also provides a --connectionRate parameter which targets the Coordinate Omission.
$ autocannon --connectionRate 1 http://localhost:8080
For more details on this subject check out this post On Coordinated Omission by Ivan Prisyazhynyy.
Avoiding unexpected behaviour during the benchmark
No article can cover all the unexpected behaviour you may face during a benchmarking phase. Therefore, using a methodology is essential to ensure the veracity of your data.
A common mistake when benchmarking an application, is to think benchmark is a _fire-and-forge_t activity (also known as the passive benchmark), which consists of:
- Running the workload tool
- Grabbing coffee, or tea
- Returning to the machine when the benchmark concludes
- Getting the benchmark result and assume that’s accurate
As explained in this article, unknown things can happen and the only way to be aware is to check the veracity of your data. Benchmark tools are susceptible to bugs like any software. Being aware of them is crucial for your decision-making.
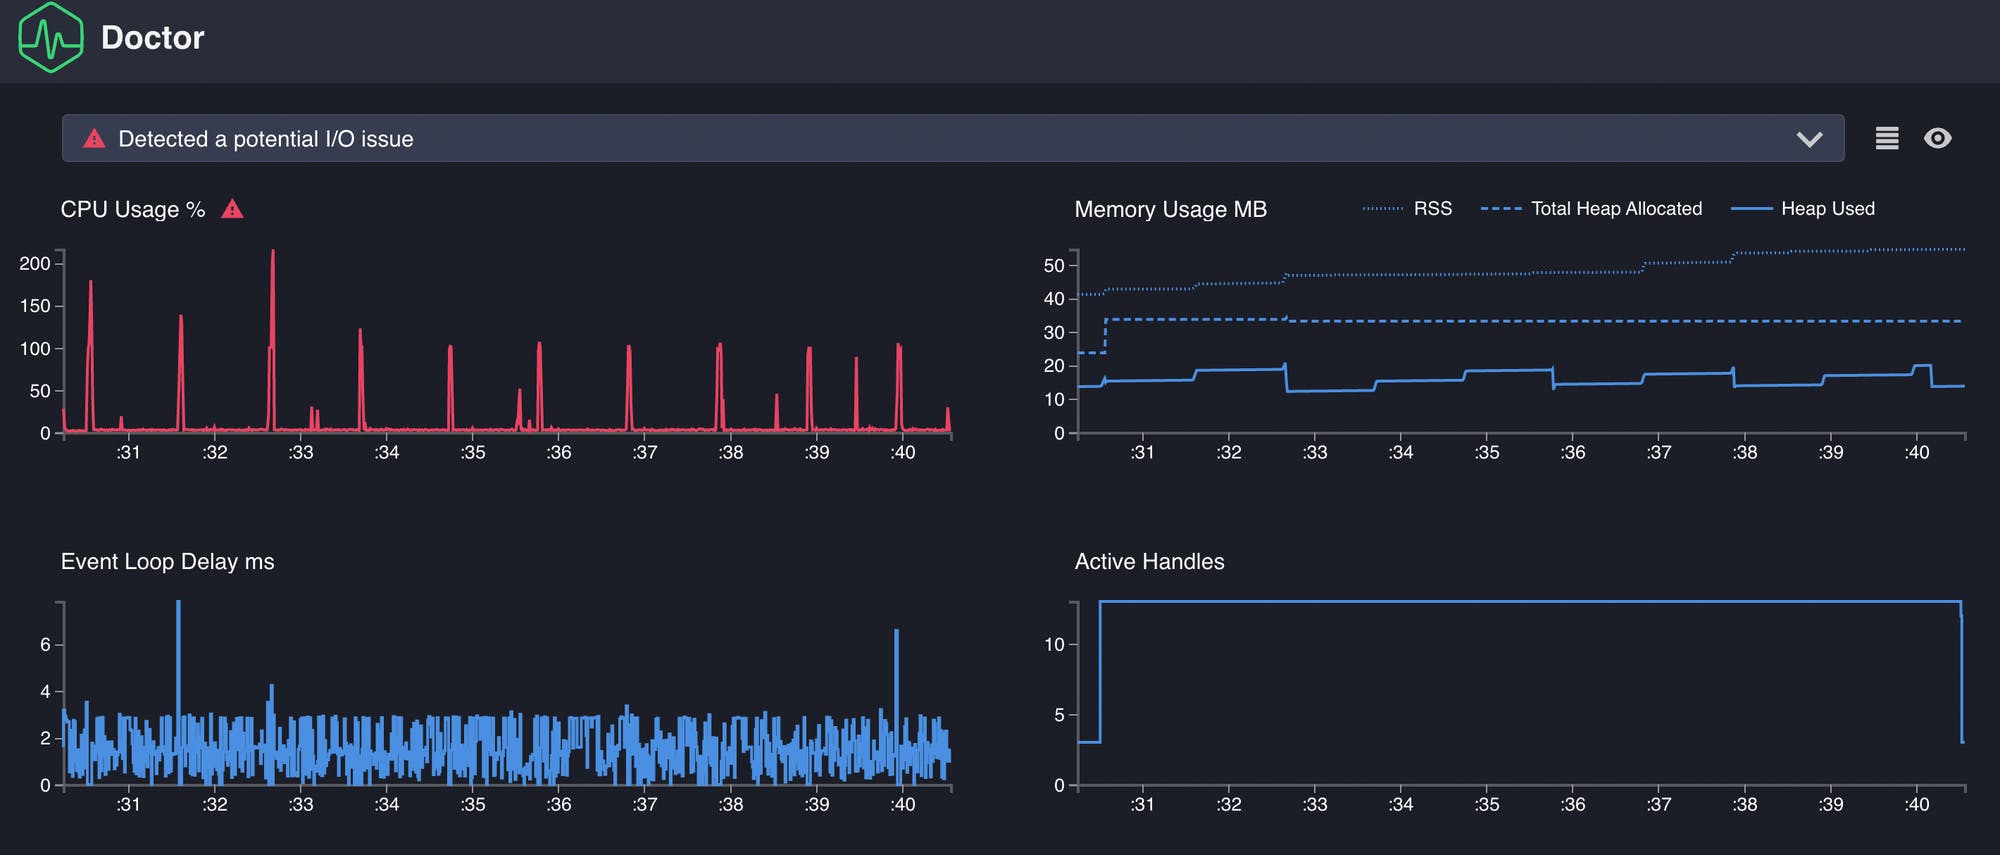
Therefore, you must analyze the application during the benchmark. This is the only way that you can collect all the necessary stats to move towards better assumptions. This methodology is also known as the active benchmark. Tools such as Clinic.js can help.
Final Conclusion
Throughout this article, I’ve tried to explain that benchmarking is definitely not easy, but once you understand its goals and limitations, any analysis tends to be more accurate.
Benchmark limitation and coordinate omission are two important behaviours that can directly affect your decision-making by hiding bugs. Hence, being aware that the benchmark tool is susceptible to bugs as with any software, is a good move.