


Improve Performance with Better Benchmarking Results
Benchmarking is all about getting reliable results and using those results as a baseline for further performance improvements. Therefore, if you don’t have reliable results, you have nothing, or worse you will be relying on false information that likely will lead you down the wrong path.
There have been several previous studies examining the effects of performance variation, a few of them were included in the References section since they were meaningful for the development of this article.
As a rant, there is an uncountable number of inaccurate benchmark results shared across the web, some of them are inaccurate because the creator is not aware of the bug — I have been in that position and you have probably been there too. There is also the one I like to call the “Marketing Benchmark”. Those are tendentious benchmarks that lead any further decision to the one they want. Hence, be careful when reading benchmark results without a reference or when sharing them on the web. Always share the source code or a reproducible example.
Turbopack was announced during a Vercel conference in Oct 2022. They shared a benchmark result that shows Turbopack 10x faster than vite. Well, as you may know, the community went into ecstasy until Evan You(vite creator) created a discussion telling why 10x is a lie.
Literally, anything can affect your benchmark, the best you can do is reduce the variability as much as you can. Programs are, eventually, non-deterministic and their execution time varies based on several system variables and conditions. Such variation makes it uncertain what the effect of a particular optimisation might be.
💡 Brendan Gregg published a video in 2008, showing that apparently, shouting in the data server significantly increases the Disk I/O Latency.
Obviously, background processes are harmful to the benchmark result, even small tasks such as the movement of your mouse during the benchmark may influence the result — You would be surprised.
For sake of clarity, let’s use the following analogy: You are a soccer coach and you need to hire one of two players:
 |  |
| Player A, who kicked all the balls to the same wrong location | Player B, who shot randomly but eventually makes the goal |
The answer is very simple, Player A. Because, you just need to teach “A” to kick to the left.
💡 Reducing variability is essential to get reliable results.
Therefore, it is strongly recommended to:
- Use a dedicated server to perform benchmarks. In AWS Console, it’s called Dedicated Instances, which are Amazon EC2 instances that run in a VPC on hardware that’s dedicated to a single customer.
- Reduce any turbulence that might affect your benchmark result — One can use
htopto see background processes and then, close them. - Try to run the benchmark as closely as possible to the production environment. This recommendation is important for performance-driven applications such as stock market software.
As stated earlier, reducing the noise is a tough operation. But, it must be done if you want to have reliable results.
Isolate your Microbenchmarks
A common mistake by developers is to not reset the environment between each benchmark run. Node.js for instance uses V8 as its JavaScript engine and as a runtime that contains a JIT (Just-in-Time) compiler, the execution order has a direct impact on perf optimizations.
Look at the following snippet:
const operations = 1_000_000 // 1 million

const test = (func) => {
  const start = performance.now()
  for(let i = 0; i < operations; i++) {
    func()
  }
  return `${(performance.now() - start).toFixed(7)}ms`
}
console.log(`Operations: ${operations}`)

console.log('arrow function', test(() => {
  const a = () => {}
  a()
}))

console.log('regular function', test(() => {
  const b = function () {}
  b()
}))
Running it will provide an interesting result:
$ node index.js
Operations: 1000000
arrow function 2.0005001ms
regular function 5.6904579ms
It seems pretty conclusive, the arrow function is almost 3x faster than a regular function.
However, when changing the order of the calls, you will get another interesting result:
+console.log('regular function', test(() => {
+  const b = function () {}
+  b()
+}))
+
 console.log('arrow function', test(() => {
   const a = () => {}
   a()
 }))

-console.log('regular function', test(() => {
-  const b = function () {}
-  b()
-}))
$ node index.js
Operations: 1000000
regular function 2.0262079ms
arrow function 5.6122090ms
Now, the ‘regular function’ is the fastest one. The reason is due to the V8 engine optimizing and de-optimizing function calls, all in the same environment.
Therefore, be sure to reset the V8 state on each run.
Evaluating Results
Metrics are hard and their evaluation is a crucial part of a benchmark report. Metrics can be confusing, complicated, unreliable, inaccurate, and even plain wrong (due to bugs).
Usually, when realizing performance tweaks on an application, a common workflow is:
- Run a benchmark before the change
- Run a benchmark after the change
- Compare the first run against the second run
Let’s assume you are measuring execution time, and the first run took 45 seconds to complete, then, the second run, after the change, took 42 seconds to complete. Therefore, you assume your changes improved the execution time by ~6%.
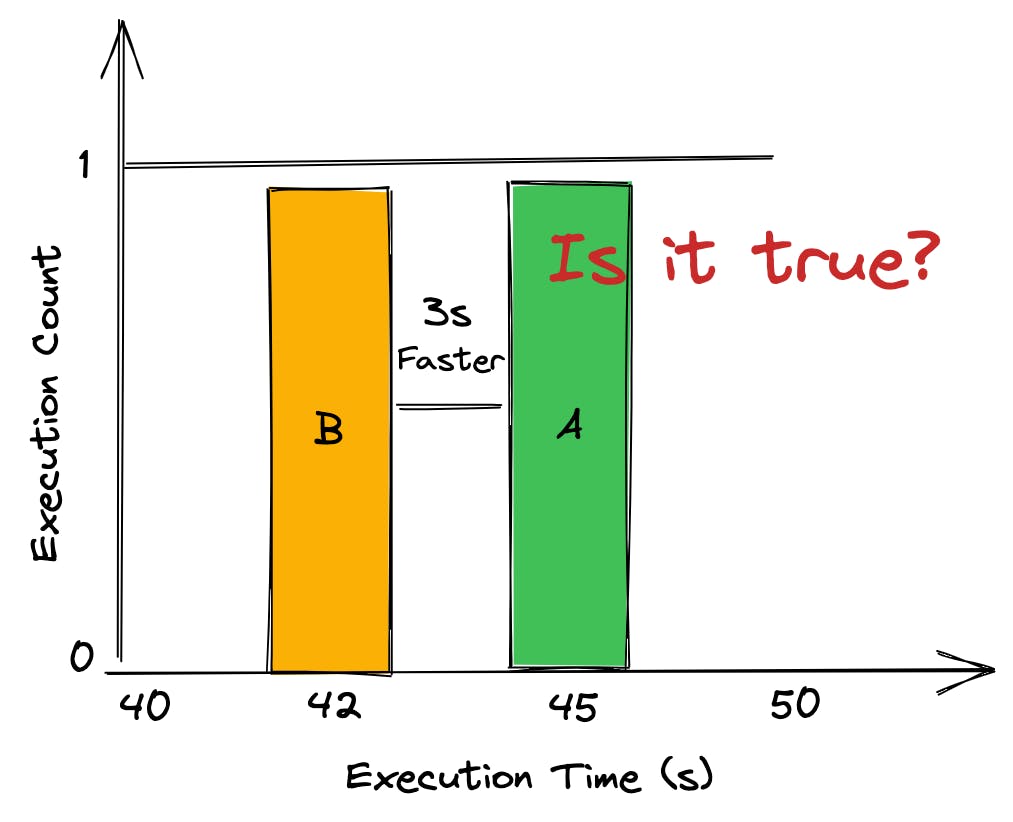
Hence, you create a Pull Request with the B changes and someone from your team performs the same workflow (benchmark before and after the change, compare the results and evaluate), but this time, the execution time took 46 and 45 seconds respectively; reducing your awesome performance improvement to ~2%.
Even reducing variability, some benchmarks simply vary. Therefore, you may ask:
- “How many times should I run a benchmark?”
The answer depends on the variance interval. The Rigorous Benchmarking in Reasonable Time¹ is an excellent resource on this topic, this paper shows how to establish the repetition count necessary for any evaluation to be reliable.
Student’s test (t-test) is a statistical method used in the testing of the null hypothesis(H0) for the comparison of means between groups. Running a t-test helps you to understand whether the differences are statistically significant — However, if performance improvements are large, 2x more, for example, there is no need for statistical machinery to prove they are real. A practical example of this method in an application is the Node.js core benchmarking suite and autocannon-compare.
While computing a confidence interval, the number of samples n (benchmark executions) are categorized into two groups:
- n is large (usually ≥ 30).
- n is small (usually < 30).
This article approaches the first group (n ≥ 30) — Both groups are covered in detail in the paper Statistically Rigorous Java Performance Evaluation² – section 3.2. The module ttest will abstract the confidence calculation. In case you are interested in the equation, see the paper mentioned previously³.
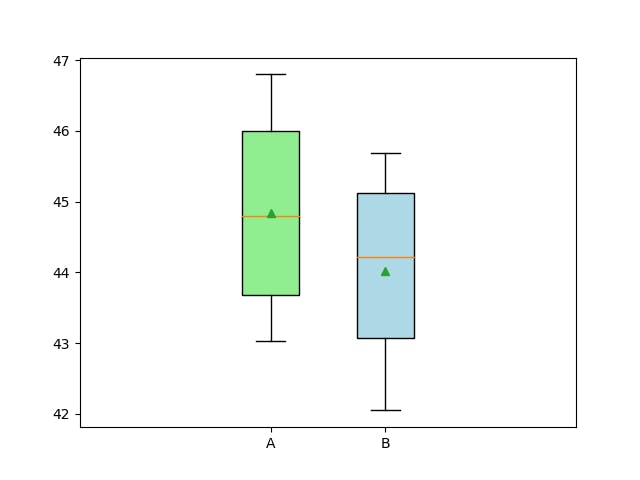
The following snippet is a collection of benchmark results before the change (A) and after the change (B):
const ttest = require('ttest')
const A = [
  46.37, 45.43, 45.1, 43.25, 45.51,
  46.8,  45.3, 43.58, 43.3, 45.42,
  46.02, 44.5, 43.94, 43.67, 43.55,
  43.71, 46.62, 46.56, 43.5, 43.84,
  45.75, 43.86, 46.76, 43.32, 44.08,
  45.92, 46.2, 46.24, 43.97, 43.03
]
const B = [
  45.69,  43.3, 45.16, 44.66,
  42.27, 42.83, 43.28, 43.01,
  43.37, 44.64, 44.85, 44.61,
  42.05, 44.01,  43.9, 42.39,
  42.24, 45.22, 45.66, 45.31,
  45.33, 45.02, 43.26, 44.43,
  45.53, 42.19, 42.44, 43.66,
  44.66, 45.55
]
⚠️ The Student’s t-test approach relies on the mean of each group. When dealing with HTTP Benchmarks, outliers can happen, making the mean useless info, so be careful with the mean. Always plot your data into a graph so you can understand its behaviour.
Then, the ttest module can be used to calculate the significance of the variance:
const ttest = require('ttest')

const res = ttest(A, B, { varEqual: true, alpha: 0.05 })
if (res.pValue() <= 0.05) {
  console.log(`It's a significant difference`)
} else {
  console.log(`It's NOT a significant difference`)
}
console.log('Confidence', res.confidence())
// It's a significant difference -  0.013473423154103548
// Confidence [ 0.17589819701261267, 1.4627684696539962 ]
This analysis enables one to determine whether differences observed in measurements are due to random fluctuations in the measurements or due to actual differences in the alternatives compared against each other. Typically, 5% is a threshold used to identify actual differences.
As a probabilistic test, the current result allows you to say: “I am 95% sure my optimization makes a difference”.
Do not forget, the benchmark insights come from the difference between branches instead of raw values and even using a probabilistic test is extremely important to know your data, plotting them into a graph is always helpful.
Be Realistic in your Benchmarks
Sometimes the benchmark result is totally accurate, but, the way they are shared is tendentious — this often happens on micro-benchmarks. For example, I maintain a repository called nodejs-bench-operations with the intention to measure simple Node.js operations across different Node.js versions and eventually, help developers to use a faster solution.
| name | ops/sec | samples |
| Using parseInt(x,10) – small number (2 len) | 176,313,641 | 92 |
| Using parseInt(x,10) – big number (10 len) | 13,267,664 | 97 |
| Using + – small number (2 len) | 711,760,317 | 96 |
| Using + – big number (10 len) | 711,137,391 | 96 |
The unit used is operations per second (ops/sec). Looking at the table it’s fair to say that “Using +” is at least 4x faster than “Using parseInt(x, 10)”.
However, you have to take this with a grain of salt. Technically, it’s indeed 4x faster, but when using it in a production application, it can mean little improvement in the end, and sometimes the trade-off to make use of a faster approach might not be worth it.
For example, the same operation measured using execution time as the metric unit will show:
| (index) | Values |
| + | 0.0012089014053344727 |
| parseInt | 0.007624983787536621 |
Therefore, for conventional software one needs to consider if 0.00641608238ms of improvement on each call is worth it.
Normally any performance improvement is welcome, but in some circumstances, the complexity or disadvantages of implementing the faster approach may not be worth it. By the way, that’s not the case with the plus signal over parseInt.
Benchmark Results can Tell you More Than Performance Gotchas
Through the results and the active benchmark, it is possible to predict the software limitations.
Let’s say you are looking at an existing system currently performing a thousand requests per second. The busiest resources are the 2 CPUs, which are averaging 60% utilization; Therefore, through basic math you can find a potential limitation using the following equation:
n = CPU count (2)
CPU% per request = n * total CPU%/requests (0.12% CPU per request)
Max request/s = 100% x n/CPU% per request (1665 req/sec)
CPU% per request = 2 x 60%/1000 = 0.12% CPU per request
Max requests/s = 200/0.12 = 1665 req/sec approximately.
This is a common supposition for CPU Bound applications, however, it ignores the fact that other resources can reach their limitation before the CPU. Therefore, 1665 req/sec can be considered the maximum req/sec this application can achieve before reaching CPU Saturation.
Final considerations
Many benchmarks simulate customer application workloads; these are sometimes called macro-benchmarks. They may be based on the workload characterization of the production environment. Macro benchmarks might be either stateless or _stateful (_where each request is dependent on the client state).
As described by the Preparing the Environment section, simulating the production workload will provide the essential information one needs to have in order to make it better. Hence, ensure to make realistic benchmarks.
As important as benchmarking correctly is the process of Evaluating Benchmark Results, understanding the data is critical for decision-making. Plotting the result into a graph is a great way to visualize outliers. Usually, the mean can hide issues, therefore, it is not recommended to rely on a single metric.
Acknowledgments
Really appreciate the ones that reviewed that long article:
and obviously, Nearform for sponsoring me to perform these studies.