

Monitor the Performance of GraphQL Queries with mercurius-explain

Measuring the Cost of a GraphQL Query with mercurius-explain
The development experience with GraphQL makes for a simple and immediate way to access data. Working on the backend means focusing on how and where the data is obtained from, whereas the frontend focuses on retrieving the data necessary for computation and display.
This freedom of action, however, hides some possible performance problems.
Fragments let you construct sets of fields, and then include them in queries where they’re needed. Developers tend to centralise the fragments definitions and use them in each query where the entity is used, even if just a subset of the attributes is necessary.
Often a client requests unnecessary data in an API call with the assumption that the extra fields are free. Instead, they are the cause of extra queries, sometimes even expensive ones. Not knowing the cost of a query makes it impossible to perform optimisation correctly.
In this article, we show how to use the mercurius-explain plugin to monitor the performance of your GraphQL APIs by tracking the behaviour of your resolvers.
Scenario
Let’s use this mercurius application to set up a simple GraphQL server:
import Fastify from 'fastify'
import mercurius from 'mercurius'

const app = Fastify()

const schema = `
  type User {
      id: ID
      name: String
      status: UserStatus
  }

  type UserStatus {
      enabled: Boolean
  }

  type Query {
      users: [User]
  }
`

const resolvers = {
  User: {
    status: async () => {
      // Retrieve the data from the DB, 20-60ms
      return { enabled: true }
    }
  },
  Query: {
    users: async () => {
      // Retrieve the data from the DB, 100-150ms
      return [
        {
          id: 1,
          name: 'Davide'
        },
        {
          id: 2,
          name: 'Marco'
        }
      ]
    }
  }
}

app.register(mercurius, {
  schema,
  resolvers,
  graphiql: true
})

app.listen({ port: 3000 })
Open the GraphiQL interface at http://localhost:3000/graphiql and test the query:
query {
  users {
    name
    status {
      enabled
    }
  }
}
In case of a slow query, the overall response time wouldn’t be enough to identify the source of the slowdown, because the query would look like a black box to the user.
How can we discover the real cost of a GraphQL query?
Introducing mercurius-explain: a Plugin for Query Profiling
mercurius-explain is a simple and lightweight Mercurius plugin that records how many times a GraphQL resolver is invoked and how long it took to retrieve the data, which helps to keep track of performance changes during development and to troubleshoot possible bottlenecks.
Setup
Fastify makes it easy to register Mercurius plugins to extend the functionality of the server and interact with the GraphQL adapter.
In the example below, we have included some boilerplate code for instantiating a new Fastify server and registering the mercurius-explain plugin.
import Fastify from 'fastify'
import mercurius from 'mercurius'
import explain, { explainGraphiQLPlugin } from 'mercurius-explain'

// schema and resolvers definition omitted

const app = Fastify()

app.register(mercurius, {
  schema,
  resolvers,
  graphiql: {
    enabled: true,
    plugins: [explainGraphiQLPlugin()]
  }
})

app.register(explain, {})

app.listen({ port: 3000 })
Once enabled, the mercurius-explain plugin takes advantage of the extensions field, natively supported by Mercurius, to inject the explain object into the response of the GraphQL API.
Two properties compose the explain object:
profilerresolverCalls
{
  extensions: {
    explain: {
      profiler: {
        data: [
          {
            path: 'user',
            begin: 100, // nanoseconds
            end: 300, // nanoseconds
            time: 200, // nanoseconds
          },
          {
            path: 'user.0.status',
            begin: 200,
            end: 400,
            time: 200,
          },
          {
            path: 'user.1.status',
            begin: 400,
            end: 620,
            time: 220,
          },
        ]
      },
      resolverCalls: {
        data:data: [
          { key: "Query.users", count: 1 },
          { key: "User.status", count: 2 }
        ]
      },
    }
  }
}
The profiler collects runtime performance metrics and shows the execution time of each resolver. It records begin, end and execution time for each GraphQL resolver.
Thanks to process.hrtime(), we get nanosecond precision, allowing us to measure even the smallest performance change.
The resolverCalls property keeps track of the times a resolver is invoked during the execution of the query.
GraphiQL integration
mercurius-explain also comes with a GraphiQL plugin that displays performance data within GraphiQL itself: mercurius-explain-graphiql-plugin.
mercurius-explain-graphiql-plugin is a GraphiQL plugin supported by mercurius and can be enabled by adding explainGraphiQLPlugin in the graphiql settings, as in the example above.
It provides a simple yet effective interface to visualise the performance of GraphQL API resolvers.
The picture below shows the profiler report of a query:
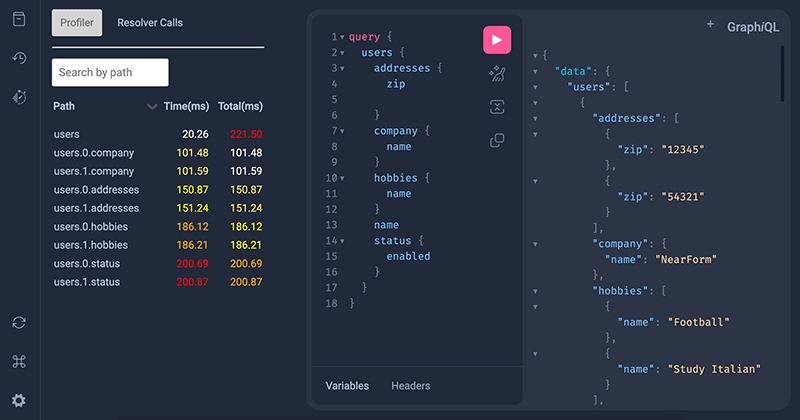
It highlights the most time-consuming operations depending on their impact on the query.
💡 Note that the total time is not equal to the sum of each resolver because resolvers are executed concurrently
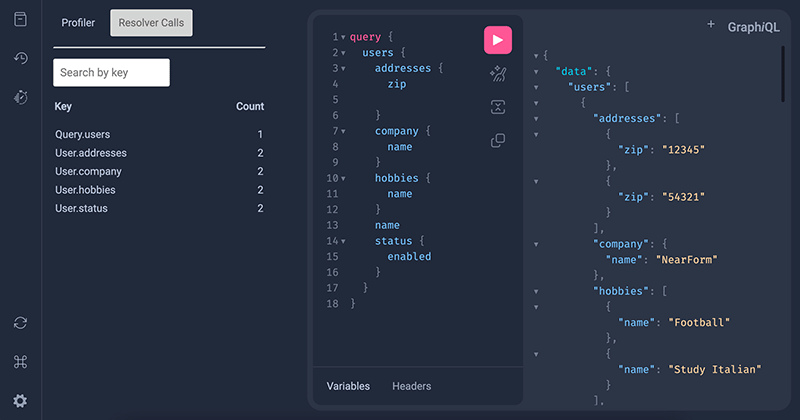
The picture below shows the data contained in resolverCalls:
Who can access the report?
mercurius-explain can be used in production because it allows fine-tuned access control.
The enabled option also accepts a function, which can be used to conditionally enable the plugin:
app.register(explain, {
  enabled: ({ schema, source, context }) => {
        return context.user.isAdmin && context.reply.request.headers['x-mercurius-explain']
    }
})
In this way, only requests sent by a hypothetical admin user and with a specific request header will receive the explain field in the response body.
Performance Impact
Any instrumentation slows down the observed system’s performance, but mercurius-explain has a very limited footprint on performance so it is suitable to be used in production. Benchmarks are available in the repository on GitHub.
Conclusions
In our experience, adopting GraphQL with the right tooling can provide significant improvements to developer experience running complex APIs.
If you’re looking to maximise your GraphQL APIs performance on mercurius, mercurius-explain is a simple, lightweight and powerful option to consider.


